Sport, Off-Road, Touring: Year 1 by the Numbers
Last week as I finished my Monday trolling of Bring A Trailer looking for my perfect 3-car garage I realized that it was week fifty-two. I told myself that I should do a wrap-up of all the cars I “bought” during that year as my next post. I promptly forgot all about it.
So, this week on Monday as I started the next Sport, Off-Road, Touring post I stopped and went ahead and started to record all my “purchases.” Turns out it takes a pretty long time to go back and look up the information on that many cars, so about half way through I abandoned the count and went ahead and picked my 3 cars for week one of year two.
So, here we go: The 156 cars I picked, if I actually won their auctions, would have cost me $11,127,321. That is an average of $71,389 for each vehicle, so obviously I was not bargain hunting.
The most expensive car I picked was in the Sport category, a 1957 Mercedes-Benz 300SL Gullwing at $1,152,0001. The second most expensive auto was in the Off-Road category, a 2014 Mercedes-Benz G63 AMG 6×62 at $901,333. The next 22 cars in order of price were all in the 6-figure range, so this probably skews that average car cost up.
The least expensive car I picked was from Off-Road category, a 2003 Land Rover Discovery II SE at a mere $6,200. It took until the sixth next highest cost car before we got to the ten-thousand-dollar mark.
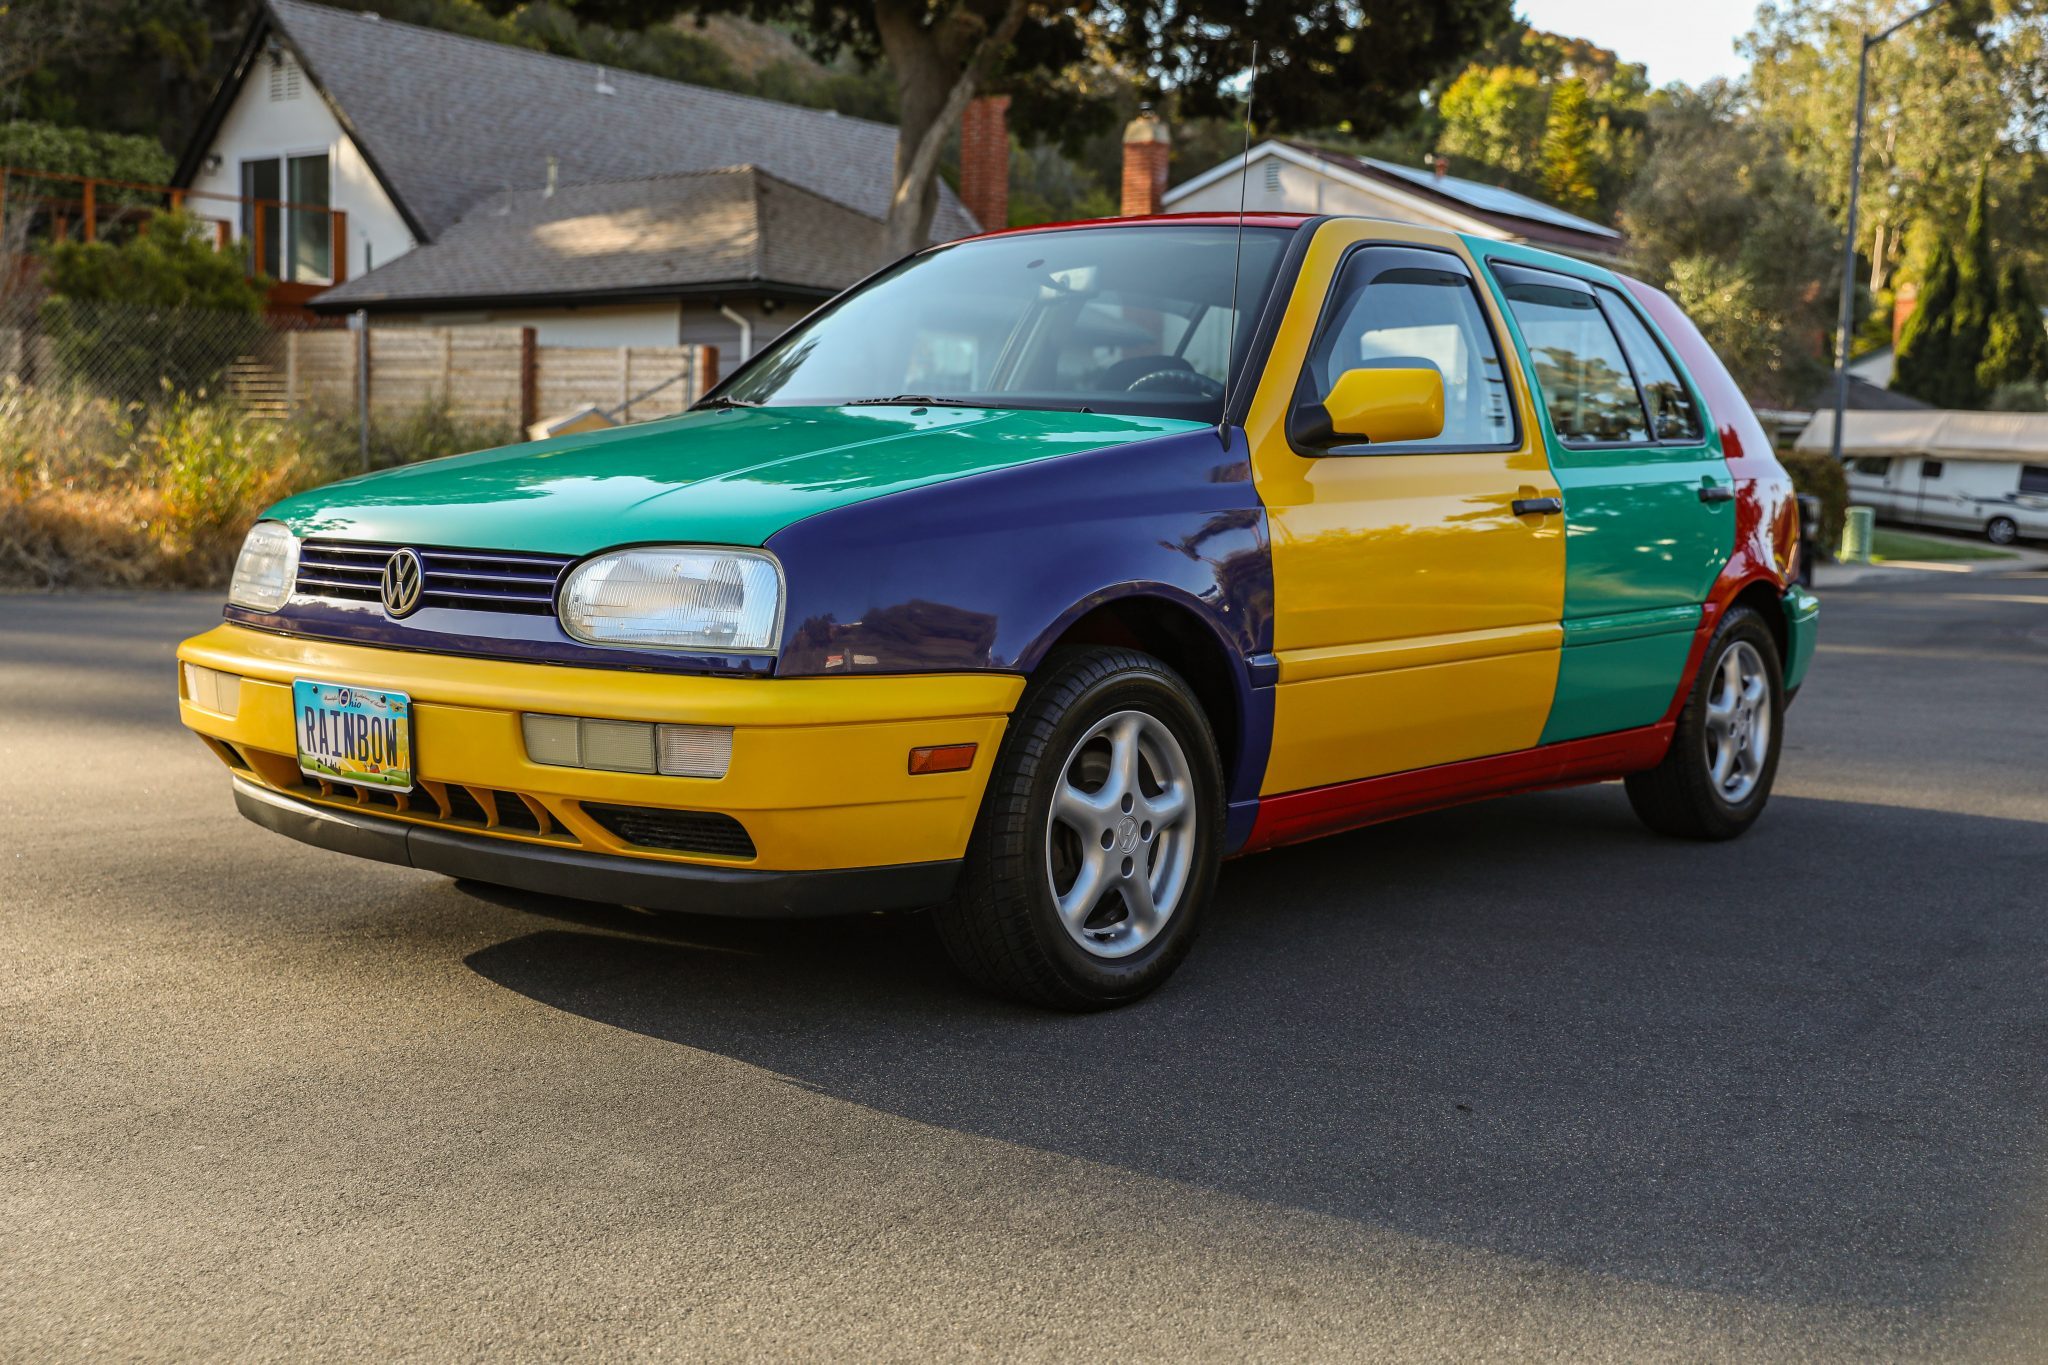
The oldest car I picked was a 350-Powered 1940 Ford Deluxe Coupe. There were 4 more cars selected from the 40’s, fourteen from the 50’s, eighteen from the 60’s and 28 from the 70’s. Taking all cars into account, the average model year car would be from 1986, even though just 20 of the 156 cars came from the 80’s. There are 18 cars from the 90’s, the 2000’s had the most cars chosen with 31 and there were nineteen picked from 2010-2019. The newest cars were from the year 2020, two Chevy C-8 Corvettes and a replica Land Rover Defender 90 NAS.
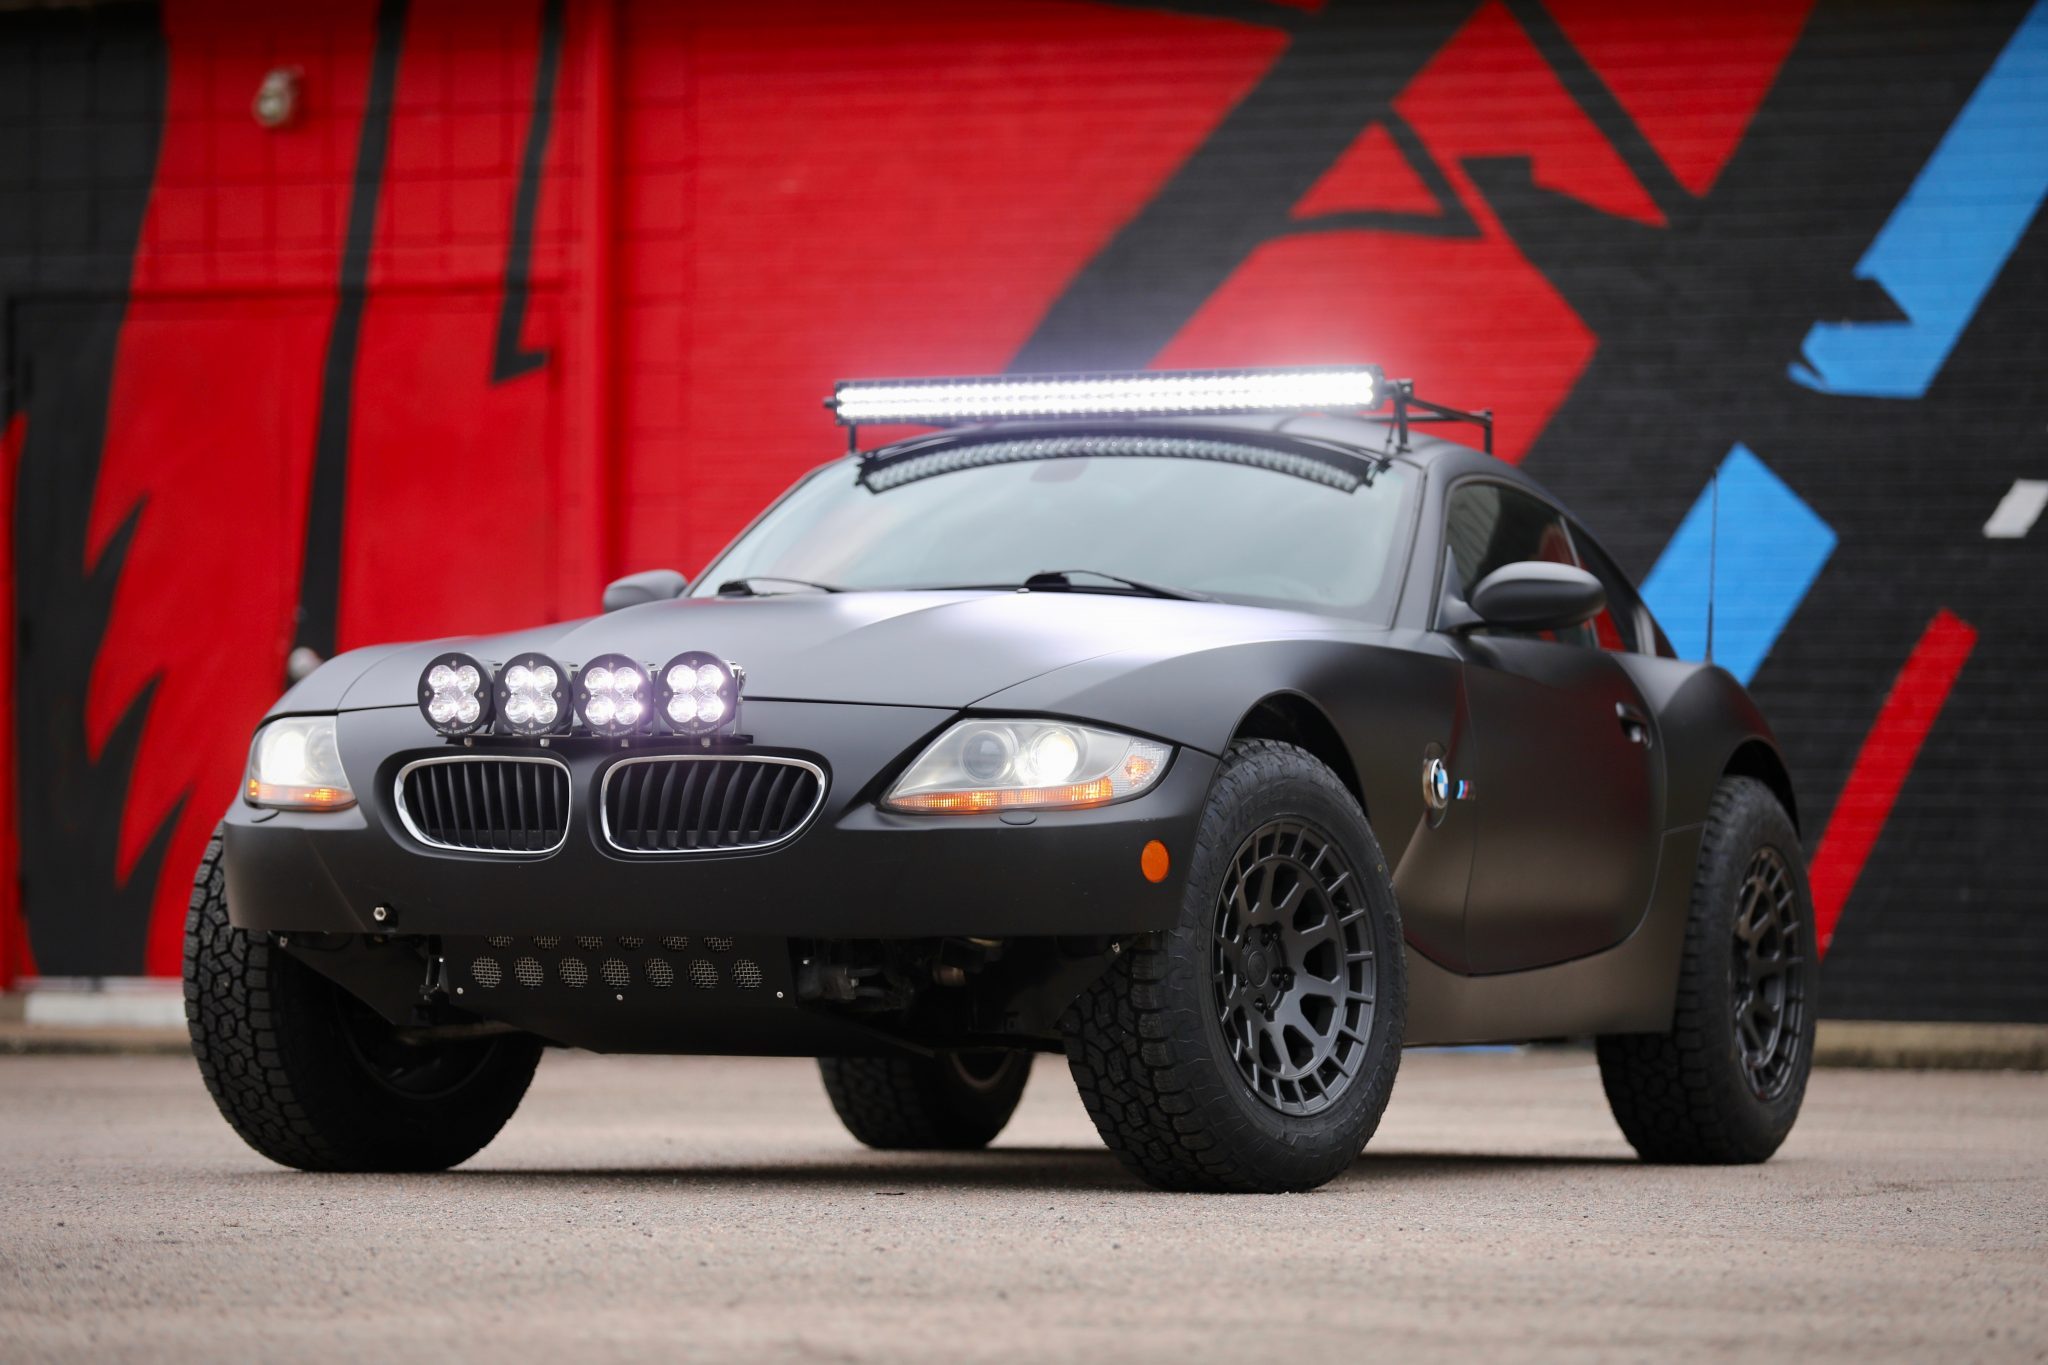
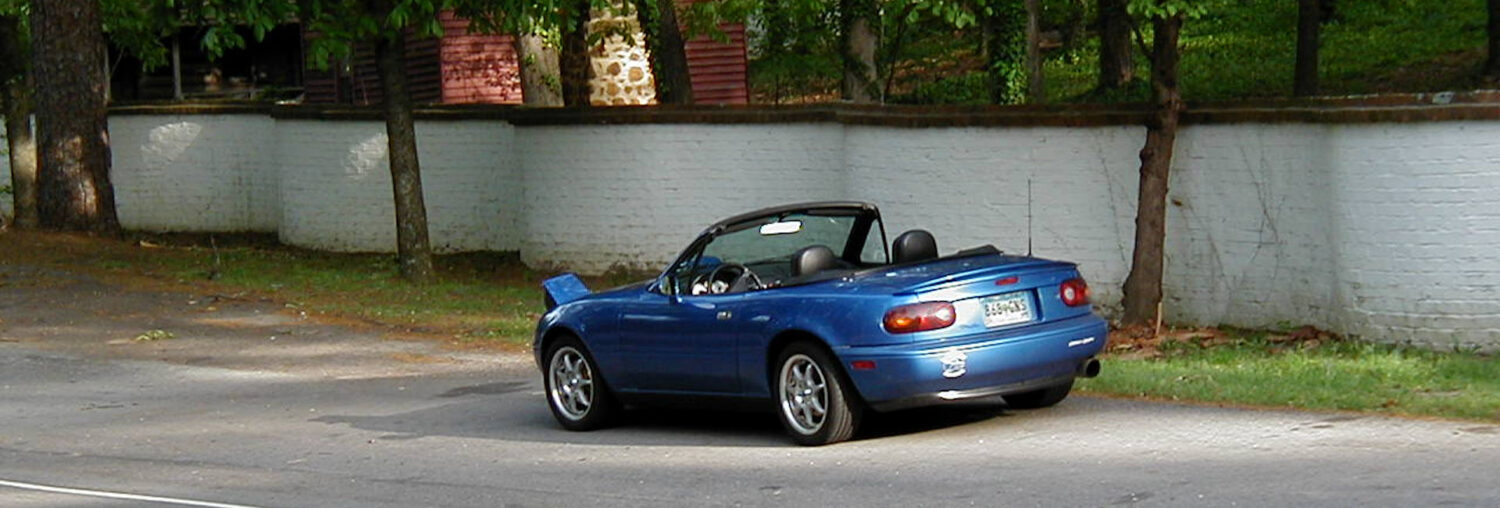
The cars came from 41 separate manufacturers. The most popular make was BMW with 17. Mercedes-Benz was the runner-up with 13. Porsche, Toyota and Ford were 3rd with twelve cars & trucks each. There were 17 one car manufacturers, including 3 that make just make replicas of cars that in original form can no longer be afforded by anyone but billionaires. And finally, one of those 1 car manufacturers, knowing me, would be probably be considered a surprise, Mazda. I only picked one Miata, but that is probably tempered a bit by the fact that I already have one.
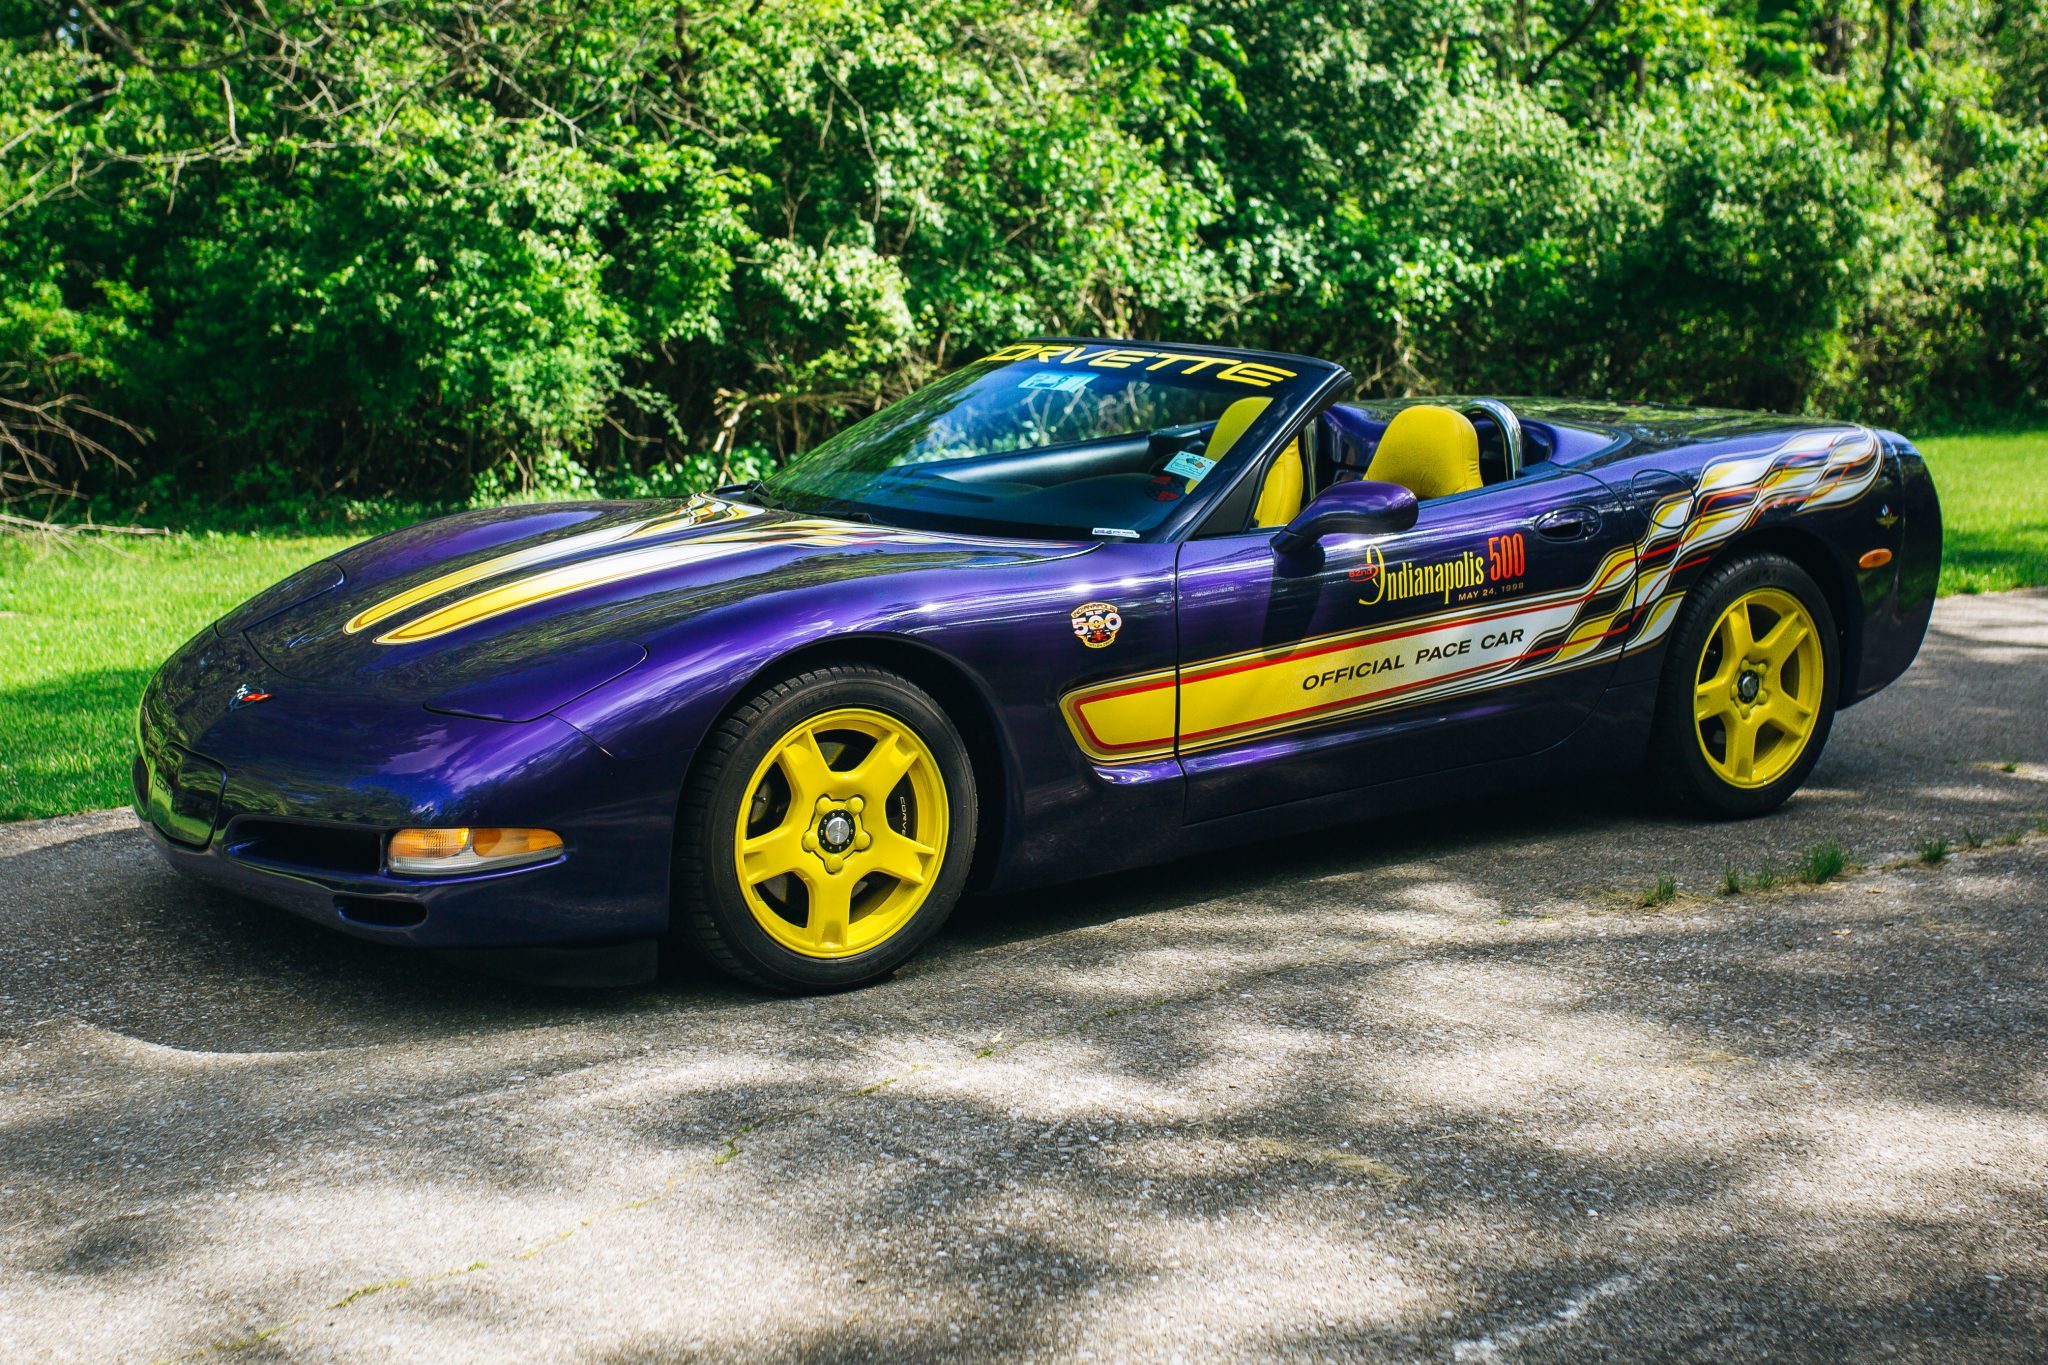
The most chosen model name was Land Cruiser (Toyota) with 8 and the runner-up was Corvette with 6. Apropos of nothing, there were 48 car names that started with numbers and 38 more that were mostly number based.
Now for some nonsense3. The most popular car, if it existed, would be a 2004 Mercedes-Benz Land Cruiser that costs $23,000 and the most average car, if it existed, would be a 1986 Honda 914 that costs $71,389.